> ## Documentation Index
> Fetch the complete documentation index at: https://docs.gocrisp.com/llms.txt
> Use this file to discover all available pages before exploring further.
# Selecting data sources for destination connectors
When setting up destination connectors, you can select and customize the data that feeds from Crisp into other applications.
**Note** : Before you begin, you must add a destination connector. Instructions for adding a destination connector differ depending on the application to which you want to export your data. For instructions, see [Exporting your data](/docs/support/articles-About-Crisp) and select the article for the relevant destination.
**To specify what's included in your destination data feed:**
1. Log into your [Crisp](https://platform.gocrisp.com/) account.
2. Add a destination connector by following the instructions in the relevant [Exporting your data](/docs/support/articles-About-Crisp) article.
3. From the *Connector source data* section, select the **Select** button\
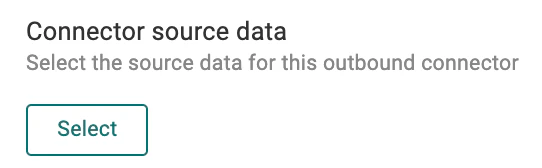 \
The *Select source data* screen appears with a list of your available source connectors.
4. From the left side bar, select the source connector from which you want to export data\
(e.g., *UNFI* ).\
\
The *Select source data* screen appears with a list of your available source connectors.
4. From the left side bar, select the source connector from which you want to export data\
(e.g., *UNFI* ).\
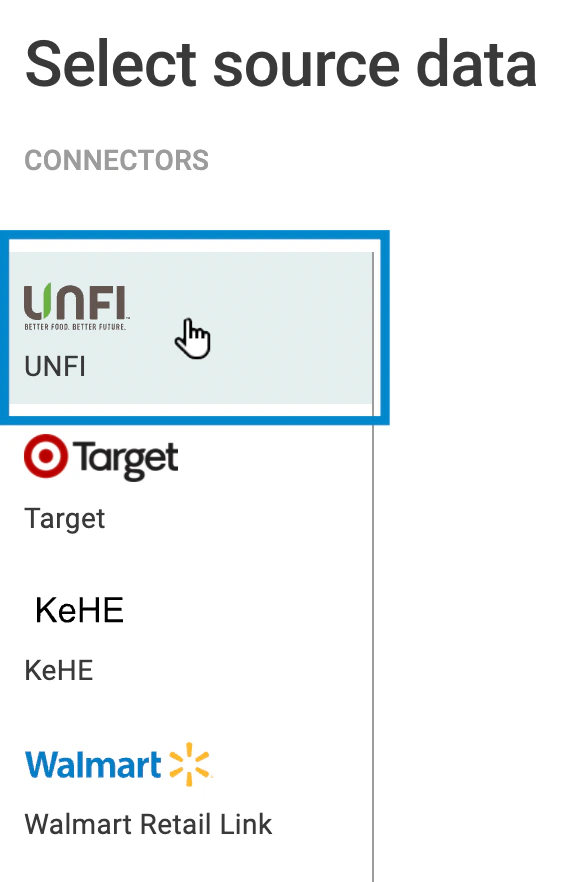 \
All the tables and columns for the connecter you selected appear.
5. Select a table (e.g., *Product by Brand with Expiration* ) that you want to include in the destination data feed.\
**Hint:** You can select the book icon to the right of a table name to see its documentation.\
\
All the tables and columns for the connecter you selected appear.
5. Select a table (e.g., *Product by Brand with Expiration* ) that you want to include in the destination data feed.\
**Hint:** You can select the book icon to the right of a table name to see its documentation.\
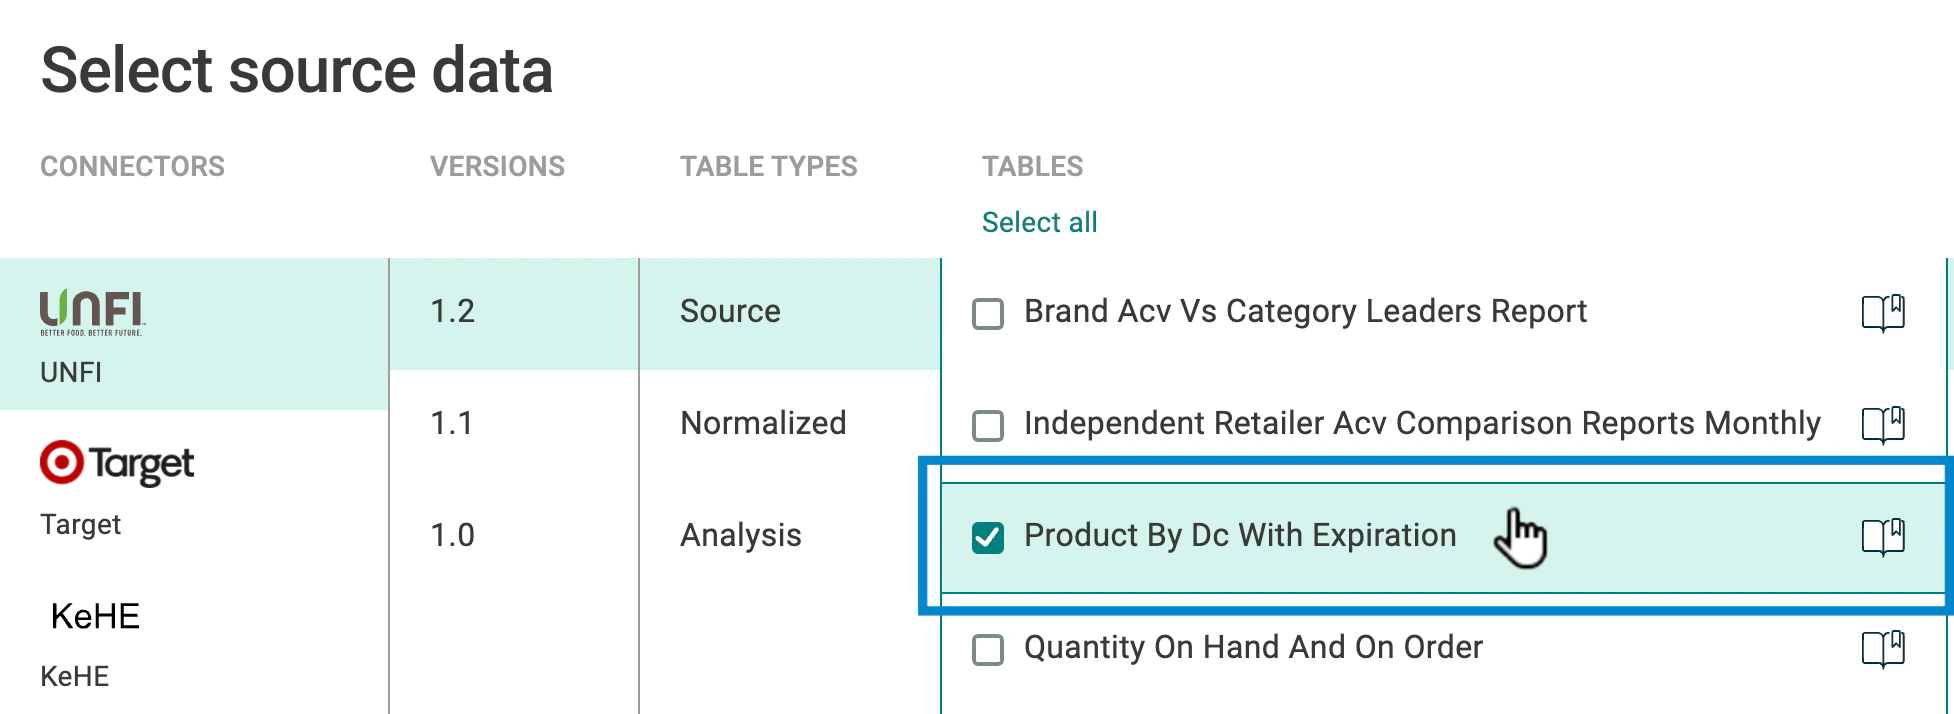 \
The available columns for the table appear at right.
6. Select the columns you want to include. Columns are divided into the following three types:
* **Time Key** : Controls how the report columns are rolled up by time.
* **Dimension** : The grouped columns in a table. For example, if a table lists every car sold in the United States, and you want to display the number of cars sold per manufacturer, the dimension you want to choose is *car manufacturer* (the resulting data is then grouped by manufacturer).
* **Measure** : Fields with values that can be measured or used for mathematical purposes. Crisp currently only supports sum calculations for measures.
\
The available columns for the table appear at right.
6. Select the columns you want to include. Columns are divided into the following three types:
* **Time Key** : Controls how the report columns are rolled up by time.
* **Dimension** : The grouped columns in a table. For example, if a table lists every car sold in the United States, and you want to display the number of cars sold per manufacturer, the dimension you want to choose is *car manufacturer* (the resulting data is then grouped by manufacturer).
* **Measure** : Fields with values that can be measured or used for mathematical purposes. Crisp currently only supports sum calculations for measures.
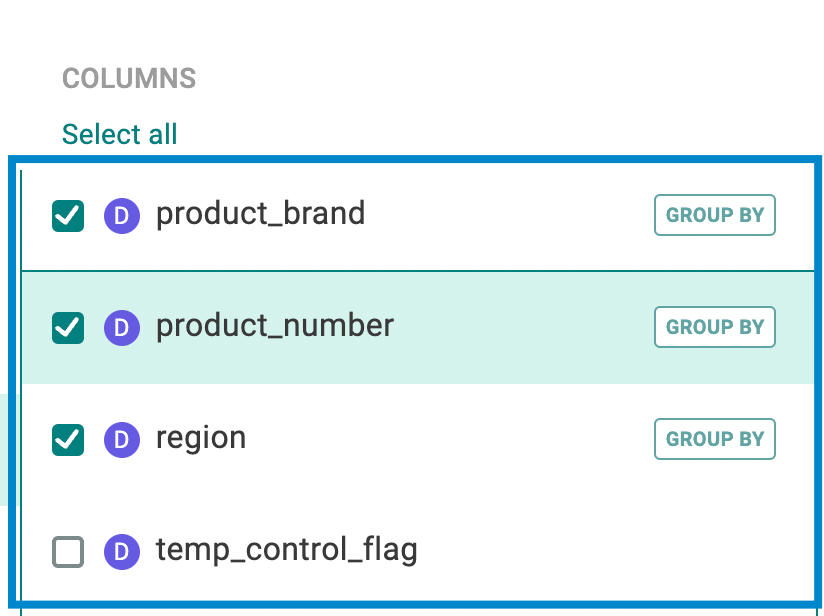 \*\*\
Hint\*\* : You can click the **Select all** and **Select none** buttons to include or exclude all items in the tables and columns.
7. You can change the time frame for how your data is rolled up, if, for example, the selected connector provides daily data, but you want to work with weekly data in your exported data feed. Just select a time frame column (e.g., *report\_date* ), then select a time transformation (e.g., *Weekly* ).
**Hint** : When you select a time transformation or deselect a column from a table, Crisp performs some operations to condense your data. For all selected Dimension columns, Crisp will group rows that have the same values into a single row. For all selected Measure columns, Crisp will aggregate values using a sum operation. The **Group By** and **Sum** labels help you see which operations apply to each column.
\*\*\
Hint\*\* : You can click the **Select all** and **Select none** buttons to include or exclude all items in the tables and columns.
7. You can change the time frame for how your data is rolled up, if, for example, the selected connector provides daily data, but you want to work with weekly data in your exported data feed. Just select a time frame column (e.g., *report\_date* ), then select a time transformation (e.g., *Weekly* ).
**Hint** : When you select a time transformation or deselect a column from a table, Crisp performs some operations to condense your data. For all selected Dimension columns, Crisp will group rows that have the same values into a single row. For all selected Measure columns, Crisp will aggregate values using a sum operation. The **Group By** and **Sum** labels help you see which operations apply to each column.
 The time transformation is applied. Selecting a time transformation will not change any of the sums. Your table will instead sum your data at the granularity you selected.\
**Note** : For the Whole Foods connector, if you select a time transformation, you must deselect the ***week\_ending* **and \_**weeks\_ago** \_columns or your time transformation will not take effect, as these columns force a weekly aggregation.
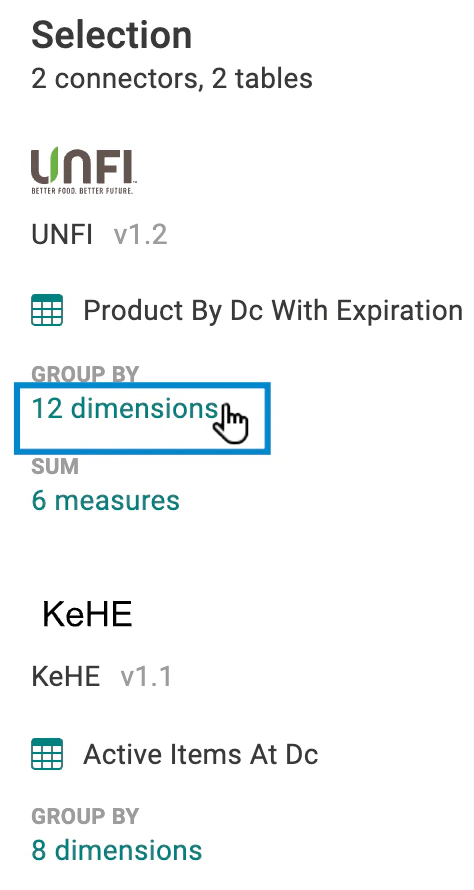
8\. If you want, review your selections before accepting them in the *Selection* panel on the far right of the screen. You can click on the condensed dimensions and measures to expand the full list of included items.\\
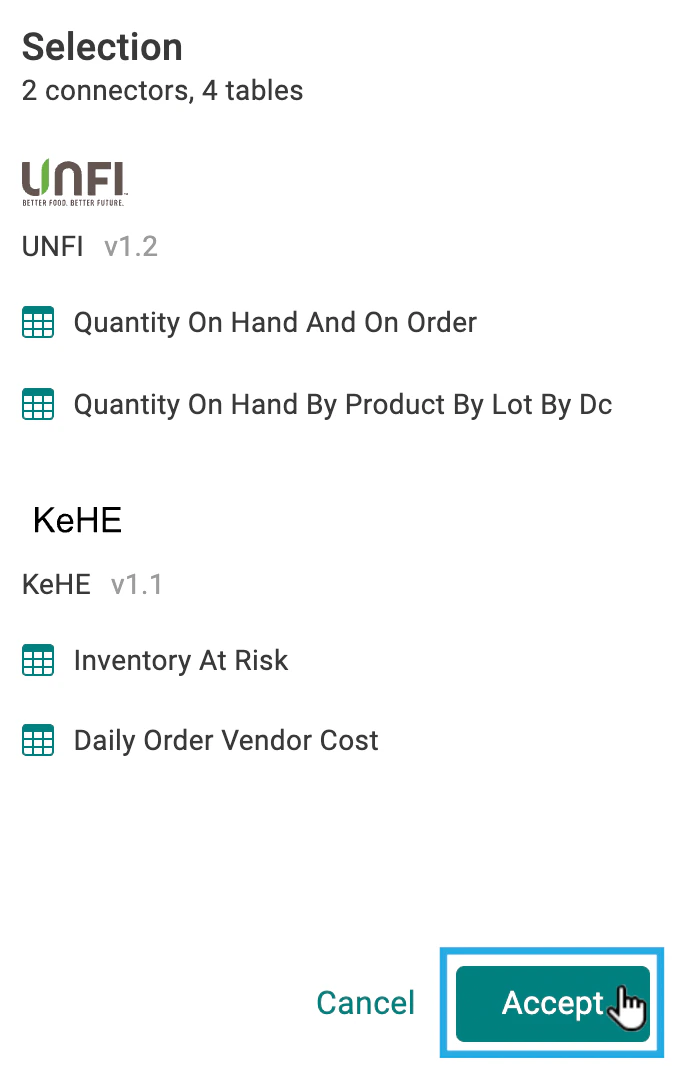
9\. To finalize your selections, select the **Accept** button.\\
The time transformation is applied. Selecting a time transformation will not change any of the sums. Your table will instead sum your data at the granularity you selected.\
**Note** : For the Whole Foods connector, if you select a time transformation, you must deselect the ***week\_ending* **and \_**weeks\_ago** \_columns or your time transformation will not take effect, as these columns force a weekly aggregation.
8\. If you want, review your selections before accepting them in the *Selection* panel on the far right of the screen. You can click on the condensed dimensions and measures to expand the full list of included items.\\
9\. To finalize your selections, select the **Accept** button.\\
 The window closes and you return to the connector setup screen.
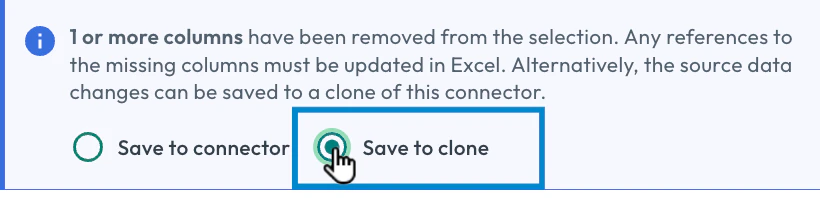
10. If you removed data from an existing connector, an option appears to clone your connector. You can select this option if you want to create a copy of the connector with your changes, so you can avoid disruptions to downstream reports and processes that use the original connector.\\
The window closes and you return to the connector setup screen.
10. If you removed data from an existing connector, an option appears to clone your connector. You can select this option if you want to create a copy of the connector with your changes, so you can avoid disruptions to downstream reports and processes that use the original connector.\\
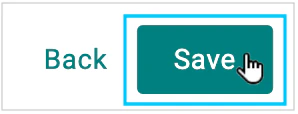
 11. Once you finish setting up your connector, select the **Save** button.
 A diagnostic checklist appears on the right side of the screen. Once all the items are complete, green check marks appear next to them and the connection is finalized.