> ## Documentation Index
> Fetch the complete documentation index at: https://docs.gocrisp.com/llms.txt
> Use this file to discover all available pages before exploring further.
# Switching UNFI dashboards
To switch to a different dashboard:
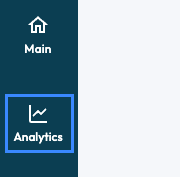
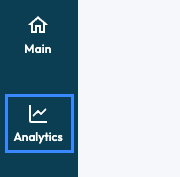
1. On the left of the screen, select **Analytics**.
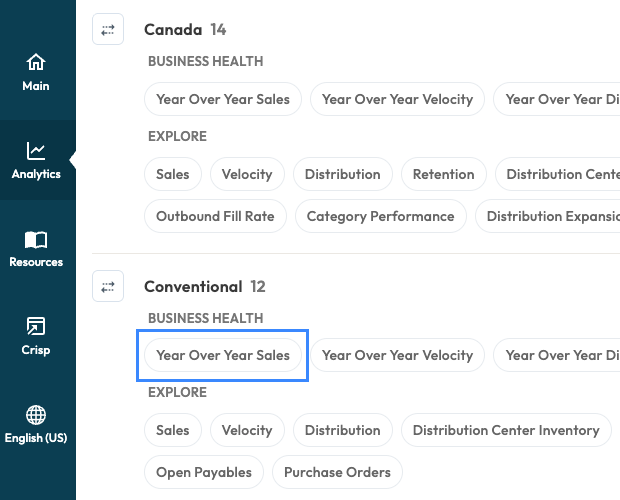
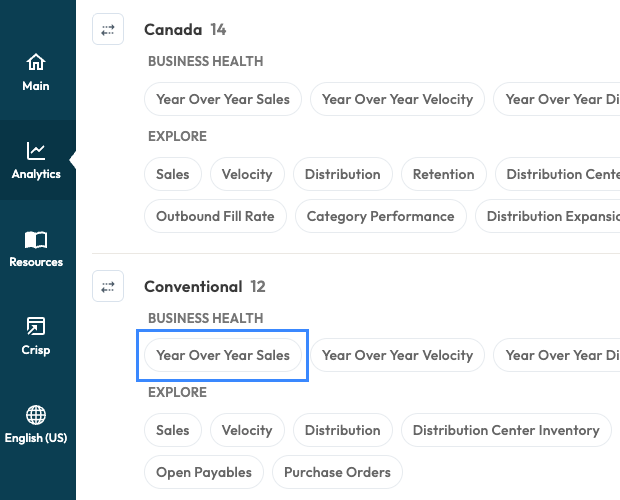
 The available dashboards appear with your pinned, saved, and shared reports at the top. The additional sections display your UNFI dashboards by line of business, Conventional, Natural, Canada, Tony's Fine Foods, and Alberts.
2. Select the dashboard you want to see (e.g., Conventional Year Over Year Sales).
The available dashboards appear with your pinned, saved, and shared reports at the top. The additional sections display your UNFI dashboards by line of business, Conventional, Natural, Canada, Tony's Fine Foods, and Alberts.
2. Select the dashboard you want to see (e.g., Conventional Year Over Year Sales).
 The selected dashboard appears. You can now apply filters to the dashboard to pinpoint specific data. To learn more, see [Applying filters.](/docs/support/articles-Applying-filters)